Tutorial
In this tutorial, we will learn how to use the Firefox developer tools to help debug JavaScript errors. Using Firefox DevTools in the course is optional, but it may help your programming if you spend a few minutes to learn how to use it. Note that this tutorial is based on Firefox Developer Tools version 1.4.
Preparation
- First, you need to install Firefox. Follow the previous link and click on the green Download Firefox button and follow the directions.
- Once installation is complete, open the page with the code you want to debug in Firefox and press F12.
- This will bring up a window, covering the bottom half of the screen.
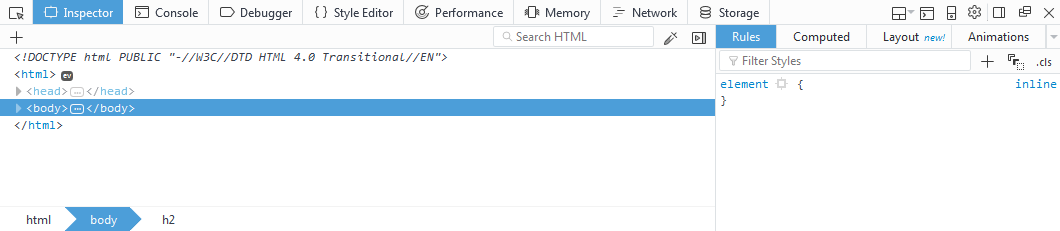
How to use Firefox Developer Tools
- Save this Sample Page to your hard drive (right click then save), so that you can edit the page. Open up your local copy of the page using FireFox and press F12.
- In the Firefox Developer Tools window, make sure Console tab is selected. You will notice the error message example.html:9:57. This means you have an error in Line #9 in your file at character 57. (if you see a character encoding error, ignore it for now.)
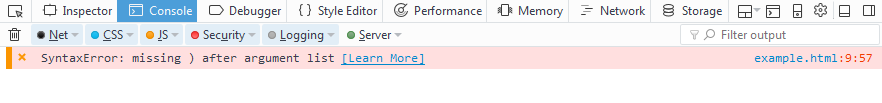
- Click the error text 'example.html:9:57', and it will highlight the code that is causing the error. Sometimes it will not be that exact line, but a line or two before the suspect line.
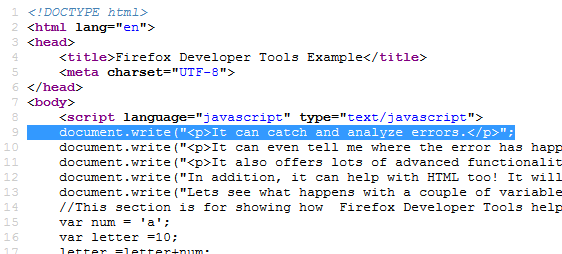
- Open up this file in a text editor of your choice and fix the error. Refresh this file, and see if the error has gone away.
- If it has, we will move on to another basic, but very powerful feature of Firefox Developer Tools: variables and stepping through code.
Stepping through code
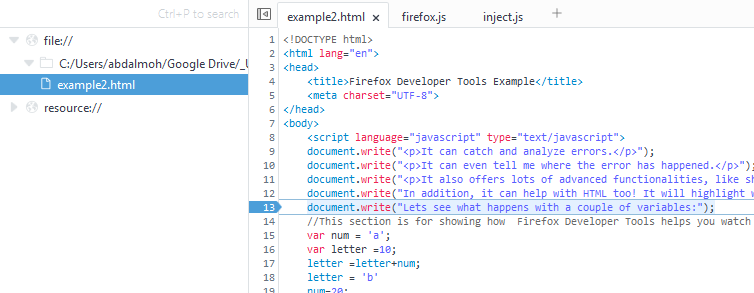
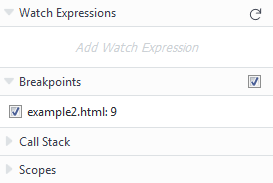
- Open up the script by clicking on the script tab. Go to line 13. Click on the number, and this will put a blue mark on it. This is called a breakpoint. It is a point where the Javascript interpreter stops, letting us see what happens after the breakpoint.
- Refresh the page.
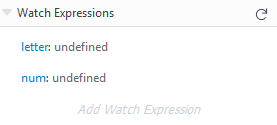
- Look at the right-hand side of the Firefox Developer Tools window. What we want to do is see what happens with two variables, letter, and num. You need to see what happens to the variables as each line of code executes.
- To do this, click on "Add Watch Expression" and you can type in an expression. In this case, we just want to type 'letter' and 'num', but without the quotation marks.
- Now, we want to step through each line of code as it happens. You should see a set of icons become active, and you can click on them.
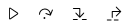
- The first icon (Resume F8) will execute the rest of the code until it hits another breakpoint.
- The second icon (Step Over F10) will skip over the current line, and if that line is a function call or block, will execute the function or block without showing every step of the way.
- The third icon (Step In F11) will go through each and every line of code, including the code inside functions.
- The final icon (Step Out Shift+F11) will exit out of any functions or blocks you are within.
The only two we care about are the first and second icons right now.
- Click the second arrow. See what happens to the two watched variables with each press of the button. If you have any questions about what is happening, ask either Abdallah or your TA.
And thats it! You're done with the tutorial!