COSC 419: Learning Analytics
A4: Project Proposal and Bayes Net Exercise [28 pts]
Due date: Mar 08, 2020, 11:59pm
What to submit:
Submit the following on Connect:
- A PDF report documenting:
- The project proposal
- The Bayes net model definition and CPTs (with rationale)
- The Bayes net structure produced from your Matlab code
- The answers for the inference questions
- If your code doesn't fully work: document which part of the assignment
you were able to finish and which part(s) did not work. In your explanation,
be sure to reference precisely the code files that you got working.
- All the code you wrote: be sure it's well documented so we know which
file or which part of the file does what (a README file would be helpful)
Specific Instructions for
Exercise 1: Project Proposal [8 pts]
Provide a short proposal of what you want to do for the individual course
project. Specifically:
- You may pick from one of the project suggestions (see bottom of this
page) or think of something on your own. To ensure your topic makes sense, fill
in the details as requested below.
- If you pick from a suggested topic:
- Indicate which topic it is
- Specify the output of the project
- Specify the steps needed to complete it
- For each step, provide a milestone deadline for completing it (in a table)
- If you pick your own topic:
- In an overview paragraph, explain what you want to do in the project.
Then mention what specific aspect of it interests you and why you want to do it.
- Specify the output of the project
- Specify the steps needed to complete it
- For each step, provide a milestone deadline for completing it (in a table)
- Ensure you have reviewed this with the instructor before submitting
it, so that the topic you pick is within the scope of this course and of a
reasonable size (similar to the ones in this list of suggested topics).
- If you are unsure about any of the details, contact the instructor well
in advance to discuss.
Grading Criteria
- [1 pts] Statement of interest
- [4 pts] Deatiled steps outlined are clear and make sense
- [1 pts] Within topic scope of the course
- [2 pts] Reasonable size
Specific Instructions for
Exercise 2: Learning Bayes Net Parameters [20 pts]
In A1, you ran a couple of Java programs and generated some data. Here, we are
going to use that data to create a simple Bayes net that is commonly used in
intelligent tutoring systems. The idea of an intelligent tutoring system is
that an individual user works on some practice questions (in this case, math
questions), and the system observes how the user is doing, and potentially
suggests hints to help the user get the right answer if the system believes
the user needs help.
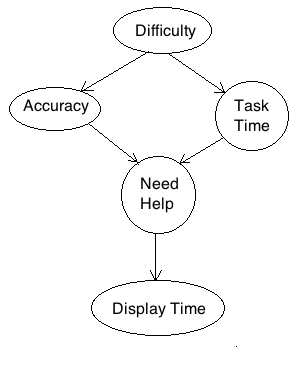
We have created a simple model for such a system. In this model, we have a
variable to model question difficulty being easy or hard (Difficulty = {easy,
hard}), which will influence whether the user gets the answer right or wrong
(Accuracy) and the time it takes to answer the question (Task Time). Both
Accuracy and TaskTime influence whether you need someone to help you (Need
Help). In our example here with an intelligent tutoring system, providing help
to the user means displaying a hint. We can estimate how much help a user
needs based on the time that a hint stays on the screen (Display Time). If the
user needs help and a hint is displayed, then the user will spend a
"reasonable amount of time" reading the hint. If the hint is given but the
user didn't actually need help, the the time spent is much less or much more
than what we would normally expect. (Less, because the hint is up and the user
just closes it without reading; More, because the hint is up and the user is
ignoring it altogether.) The graphical model is drawn in the diagram below.
To make things more consistent, I am defining the remaining random variables
Accuracy, TaskTime, NeedHelp, and DisplayTime with the following values:
- Accuracy = { wrong, right }
- TaskTime = { slow, fast }
- NeedHelp = { false, true }
- DisplayTime = { short, average, long }
At this point, you can now define the structure of the Bayes net in Matlab
using the BNT package. You may want to do this now and check the structure
before moving on. You can do this by viewing bnet.dag where bnet is the Bayes
net you defined, then manually inspect the array elements to make sure the
only elements with 1 is where there is a parent to child relation.
Remember that a Bayes net also has a quantitative component which are the
CPTs. Define the CPT for Pr(Difficulty) with a uniform prior distribution.
Next, you will define the CPTs for Pr(Accuracy|Difficulty) and
Pr(TaskTime|Difficulty) using data collected from A1 (download
all-hard.txt and
all-easy.txt) to figure out the average accuracy
rate and the average task time for each of the easy and hard conditions. These
times are in nanoseconds so you'll want to convert them back to seconds. (The
average times I got are 6.3859 secs with 96% accuracy for the easy condition,
and 30.0690 secs with 89% accuracy for the hard condition.) For Accuracy, just
use the average accuracy to define Pr(Accuracy=right|Difficulty). For
TaskTime, compute the frequency when TaskTime is below the average, then use
that percentage to define Pr(TaskTime=slow|Difficulty). Using the data, when
Difficulty is easy, I got 37% of the times that TaskTime is slow. You can do
the same calculation for the other condition when Difficulty is hard.
After you entered the Bayes net into Matlab, you may want to use the command
"get_field( bnet.CPD{Acc}, 'cpt' )" to display the probabilities that got
input into your model (with variable name bnet) at the index Acc (which I
defined to be 2 as the second variable representing Accuracy).
As we don't have data involving NeedHelp, the last step in creating the model
is to handcraft Pr(NeedHelp|Accuracy,TaskTime) and Pr(DisplayTime|NeedHelp)
with reasonable parameters and explain in English the rationale you used to
define these parameters.
Although we don't have data for DisplayTime, we have some idea of how long
people take to read. Download all-read.txt to
figure out the average time it takes for someone to read a word. (I got 0.2772
sec per word using the data.) Assuming a hint is about 25 words, come up with
the average reading time you would expect for reading a hint. Using that
average, define the range below it that would indicate the person is reading
too fast (so perhaps just closing the hint without reading it) or that the
person is taking too long to read it (so perhaps the hint is just ignored).
Use these bounds to define DisplayTime. Make sure you state clearly what
bounds you use in your definition because you will need this for the query
below.
Once you have encoded the above network:
Let's say the system put up a hint and we observe that the DisplayTime for
that hint was 10 seconds. Now, what is Pr(NeedHelp=true|DisplayTime=long) = ?
In my model, 10 seconds corresponds to a value that is too long for an average
person to spend reading a hint. Figure out what 10 seconds means in your
model based on your variable definition and adjust your query accordingly.
Grading Criteria
- [1 pt] CPT for Pr(Difficulty)
- [4 pts, 2 pts each] scripts to compute accuracy and task completion time averages
- [2 pts] script to estimate the average reading time for a hint
- [4 pts, 2 pts each] CPTs for Pr(Accuracy|Difficulty) and Pr(TaskTime|Difficulty)
- [2 pts] reasonable definition for Pr(NeedHelp|Accuracy,TaskTime) with rationale
- [2 pts] reasonable definition for Pr(DisplayTime|NeedHelp) with rationale
- [2 pts] script to compute the average reading time for a word, and
clear definition of the bounds of what constitutes DisplayTime being too
short, average, and too long in Matlab
- [2 pts] script to encode the Bayes net in Matlab
- [1 pts] Matlab script and values for the probability that the user
needs help is true when a hint was read for 10 seconds
Note: You may have just one Matlab file with all your code in it, rather than
separate Matlab scripts.
Resources:
Project Suggestions
- Implement the junction tree inference algorithm according to the steps
defined in ``Inference in Belief Networks:
A Procedural Guide'' (Huang and Darwiche, 1996). Test it out on a sample
Bayes net. Note that this option is quite involved so building the secondary
structure successfully will get you an A- in the project. Getting the
propagation part working correctly will get you more marks. Also: don't use
a language that has types (e.g. Java), it will cause you a lot of pain with
the potentials.
[Group of 2 version:] The above steps and completing the propagation part.
- [Group of 2]
Implement a simple version of GPLAG that automatically creates a
dependency graph given an input source code. Test your code appropriately
and show clearly that it works. For each pair of input source code, and
compute the distance between their corresponding graphs. Show your results
for the following test cases and provide the associated Java code:
(i) when 2 programs are obviously different,
(ii) when 2 programs are obviously similar/plagiarized from each other,
(iii) when it's unclear (by human eye) whether 2 programs are similar but
their dependencies show that they actually are similar, and
(iv) when it's unclear (in any way) whether 2 programs are similar.
-
Use an API (such as LinkedIn) for learning skill sets from users and
job postings. Narrow your focus to specific types of users (e.g., ages 20-25
and job postings in one geography). Do simple data analyses to visualize
user skills (e.g., most common) and skills needed in job postings (e.g.,
most sought after skills).
[Group of 2 version:] Identify users who are similar to each other and
jobs that are similar to each other. Finally, conduct a simple analysis
between the two sets of skills to identify whether users have the skills
required by today's jobs. (Be sure to clearly explain your analysis methods,
why you chose those methods, and the results you found.)
- Explore a social media API of your choice to gather actual data from
specific user accounts to interpret learning information (e.g. identify
topics students have trouble with, identify the major complaint topics,
identify major and positive contributers to discussions, identify types of
contributions made in discussions). Create a visual dashboard for an
administrator to see these analyses.