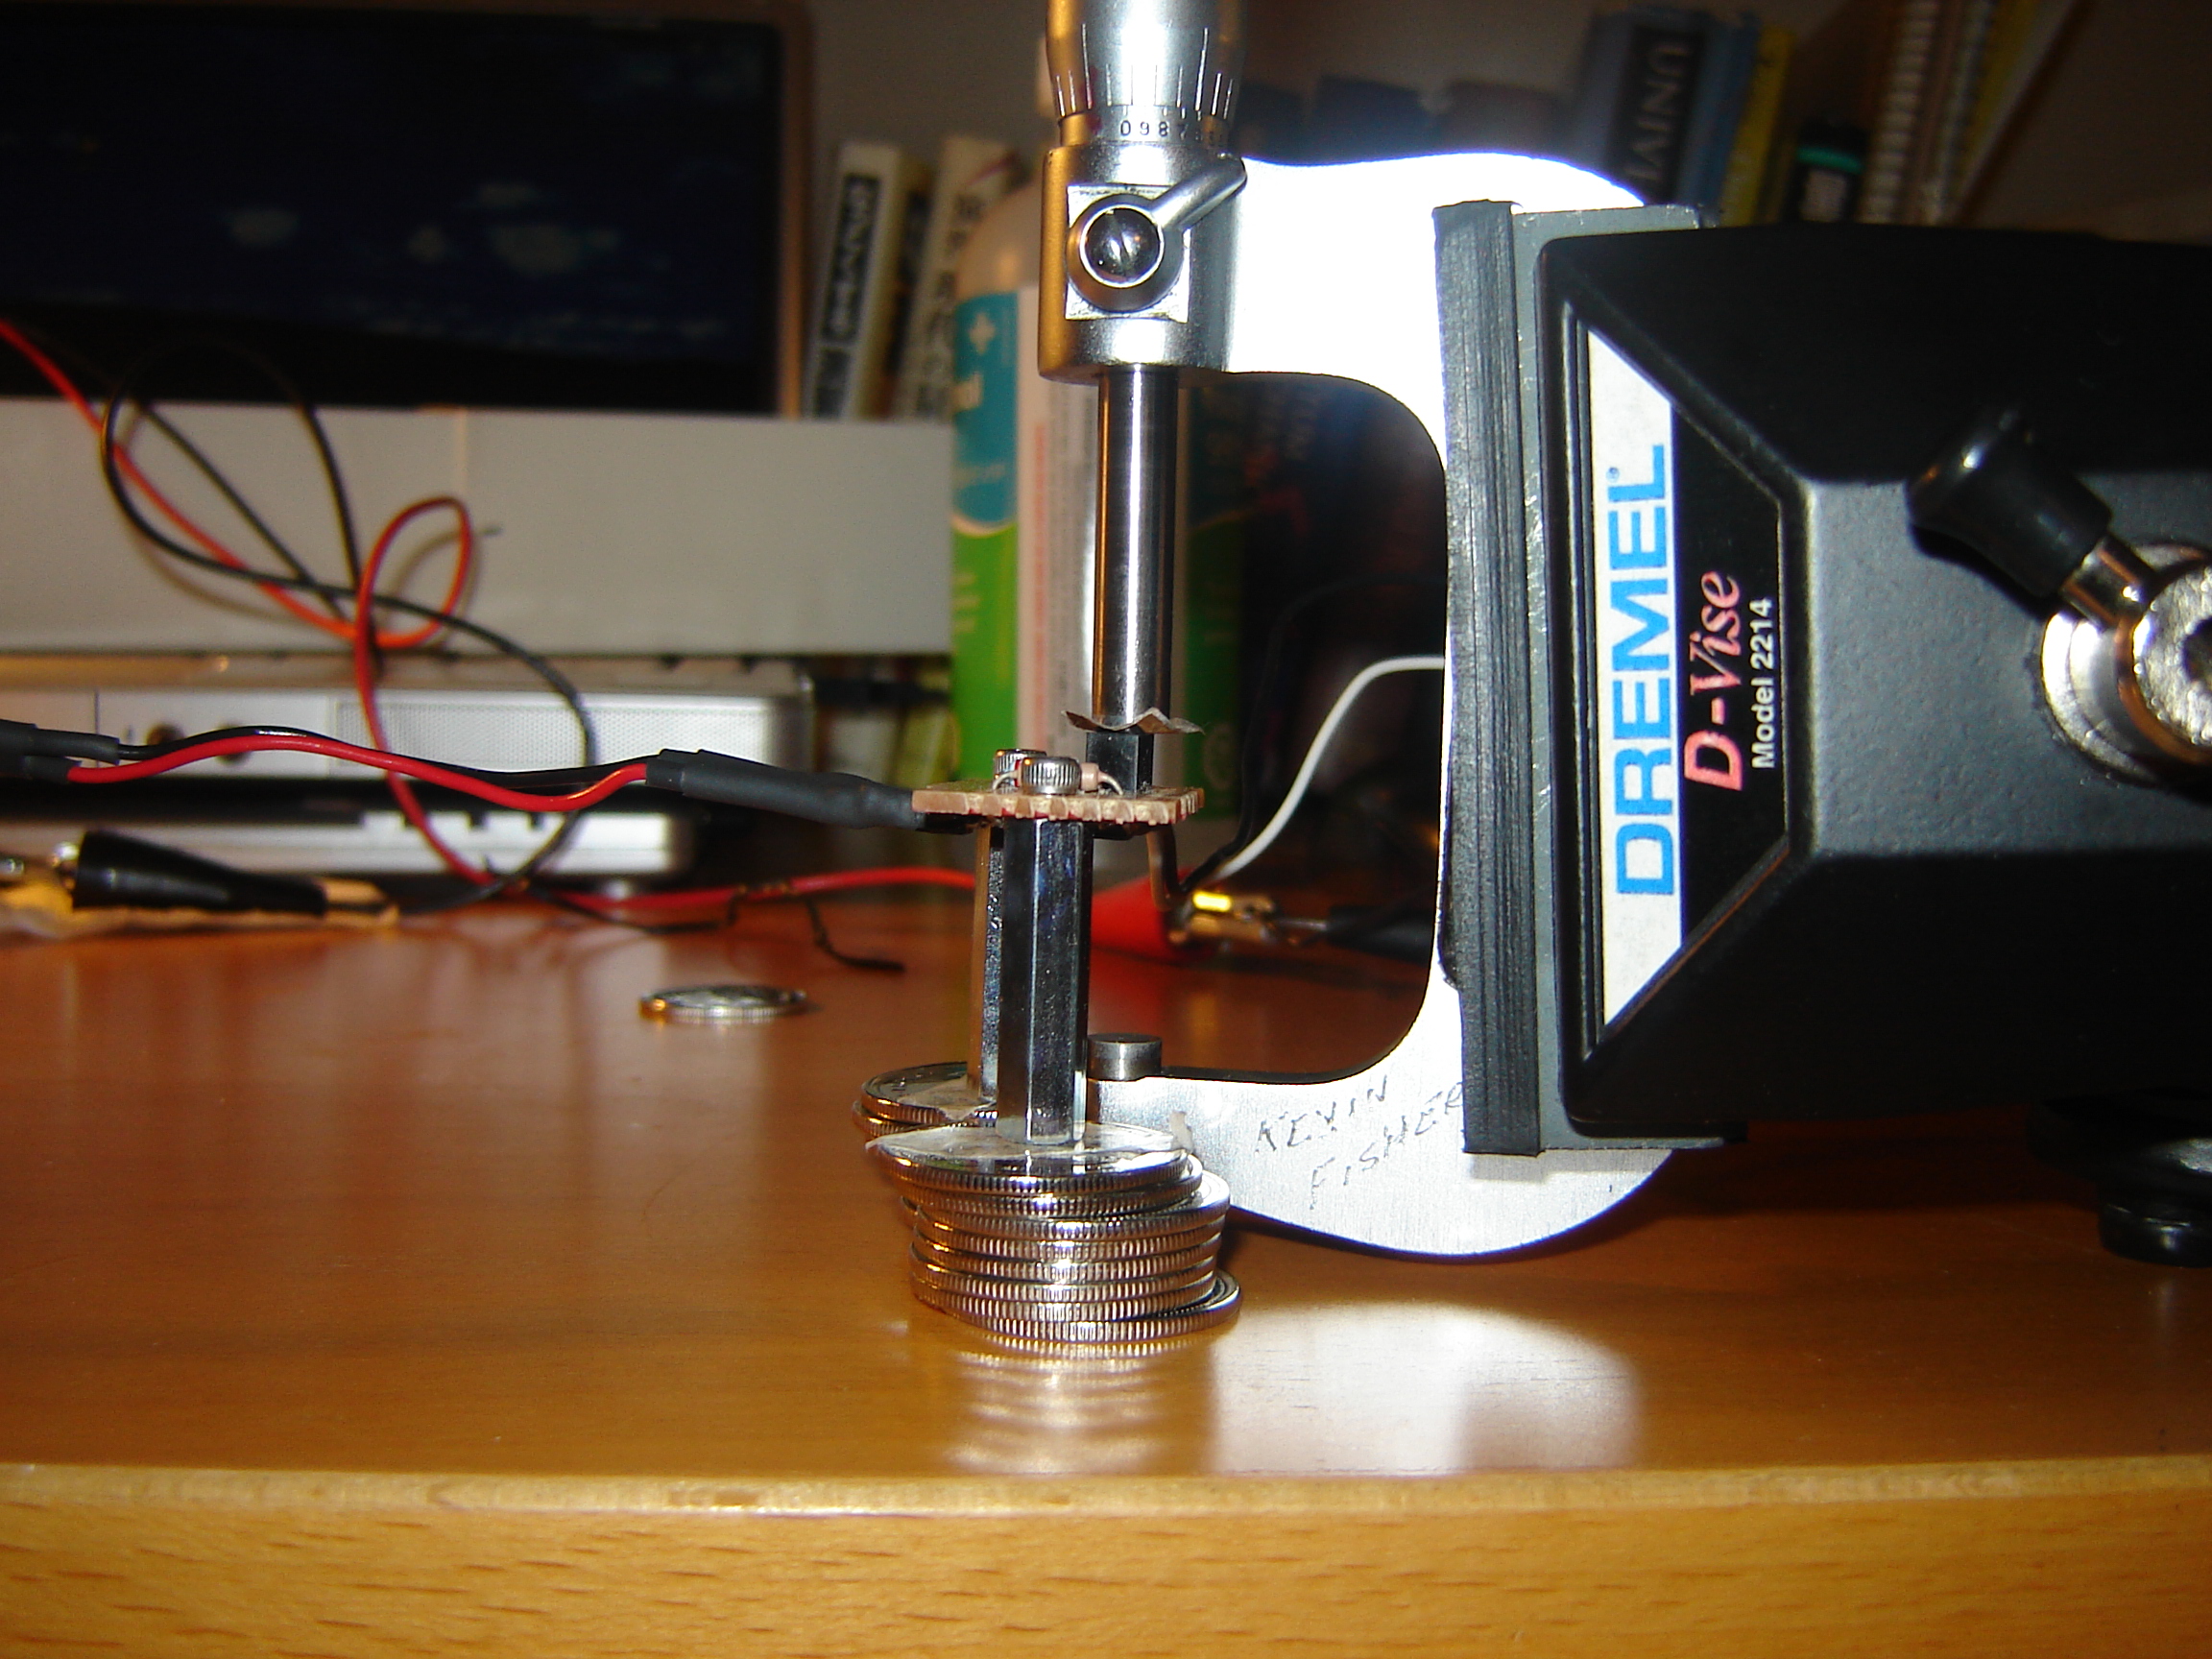
Figure 1: Setup for Calibration of IR sensor
|
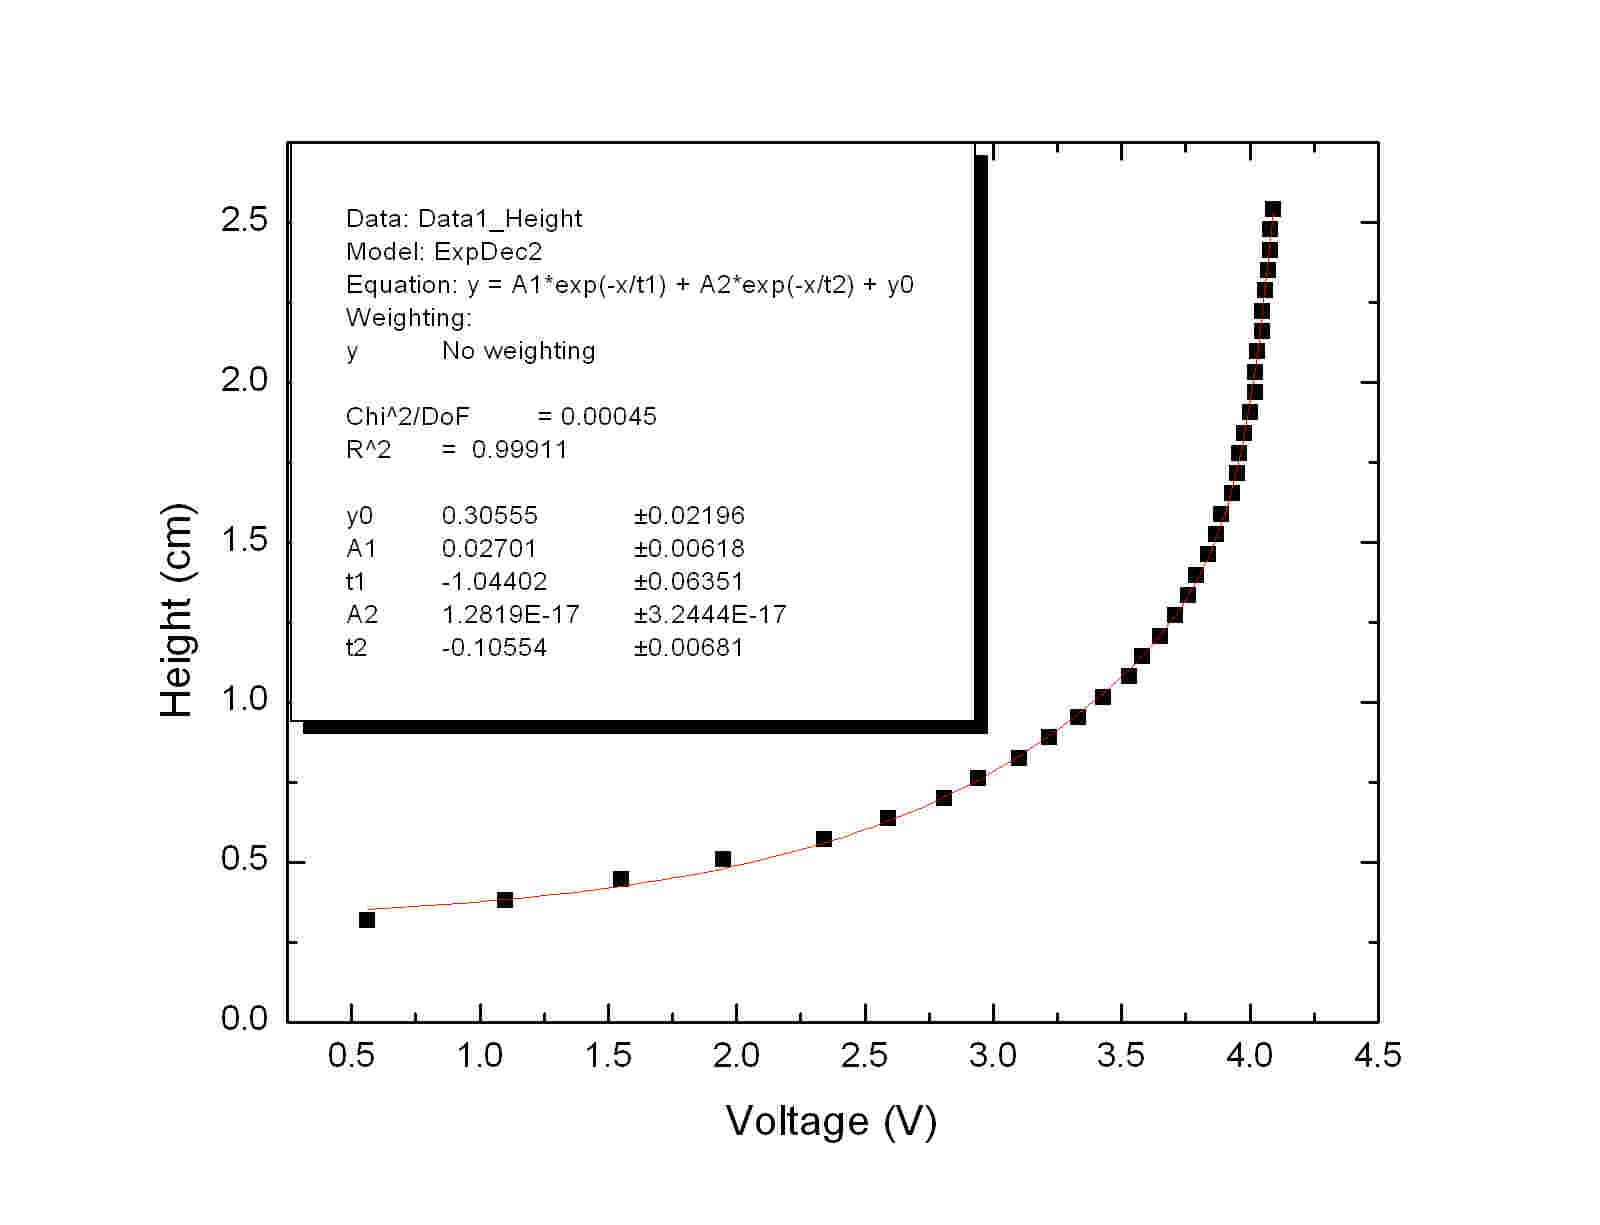
Figure 2: IR sensor calibration curve
|
|
To construct a plot of Pressure versus volume diagram for the Stirling engine, the
change in volume of the gas inside the engine was monitored using the photodetector. This photodetector
meaures the change in the height of the reflector glued on the power piston. A relationship to convert
between the output voltage from the photodetector and the height of the reflector was determined
using the setup shown in Figure 1. A micrometer, with a piece of reflective aluminum foil attached to one end, was
positioned above the sensor. The voltage output by the photodetector was measured as a function of the reflector
height. The height of the reflector is plotted as a function of the photodetector voltage in Figure 2. The function
and parameters fit to the data are shown in the inset of the figure.
|
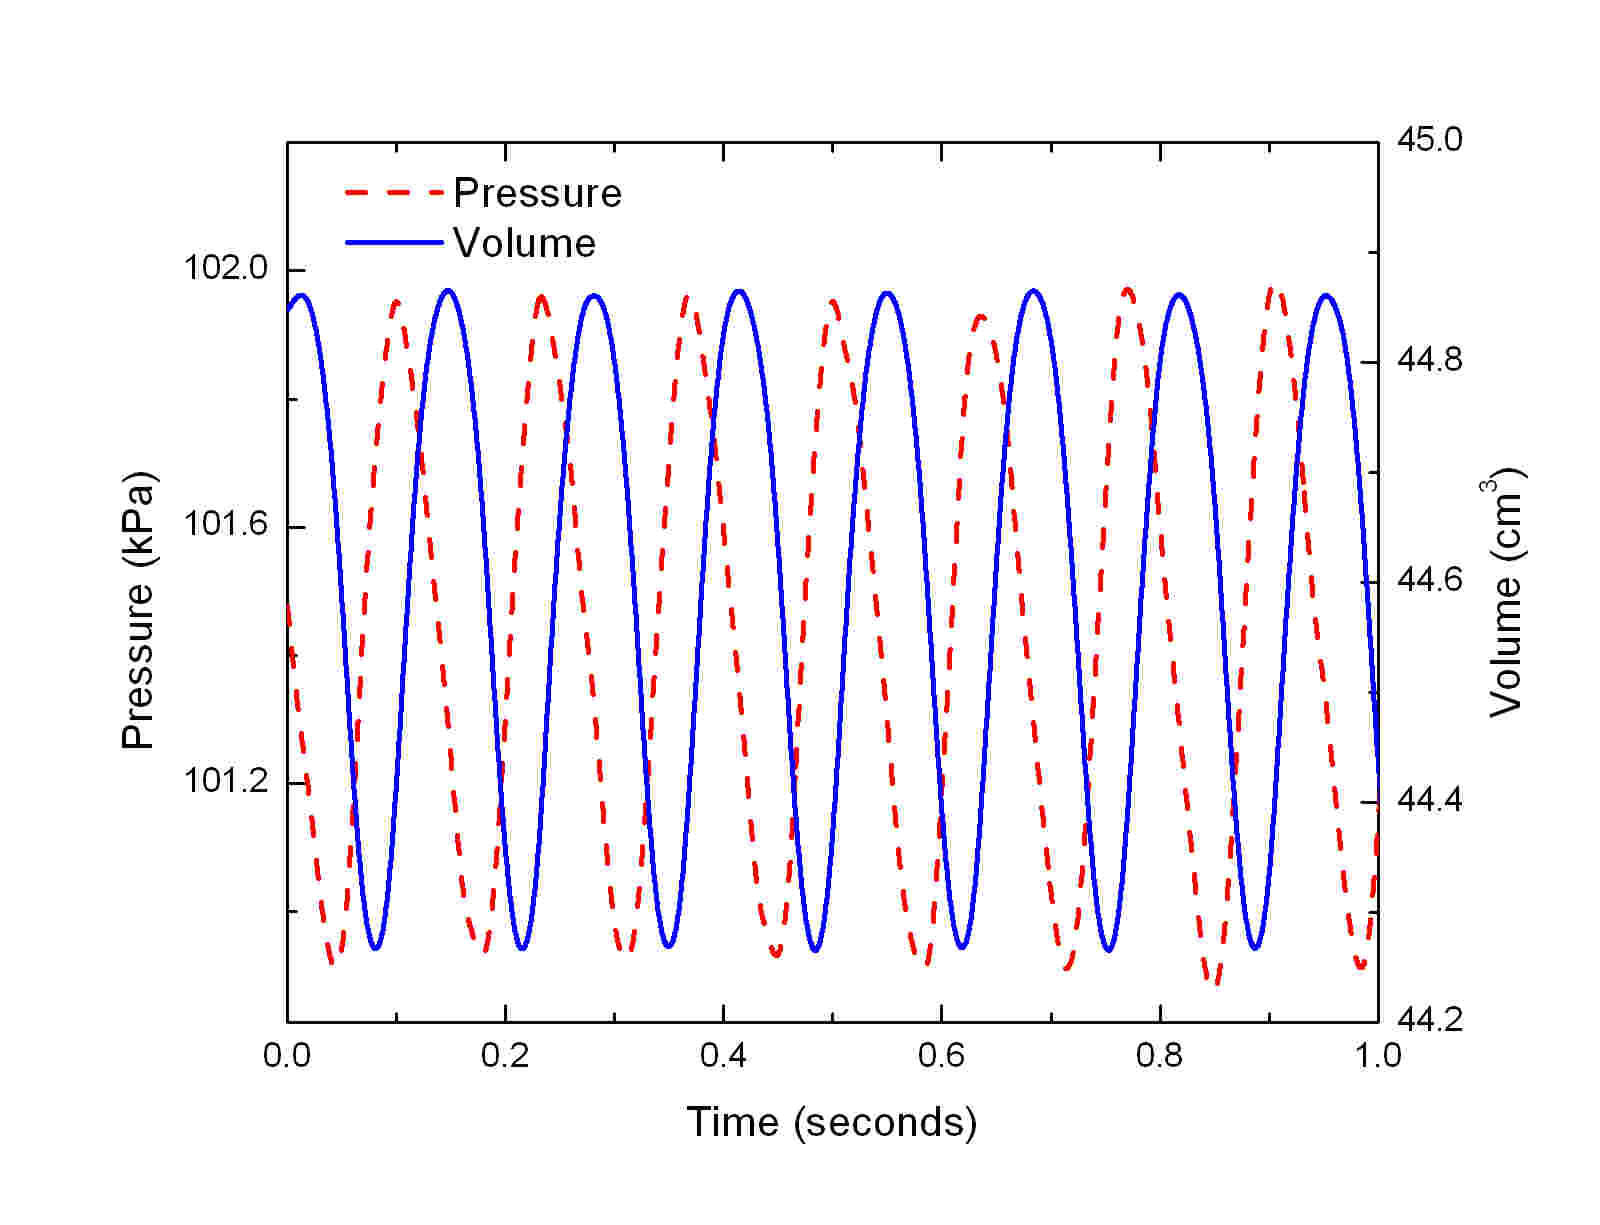
Figure 3: 90oPhase Shift
|
If Figure 3, the pressure and the volume of the Stirling engine are plotted as a function of time. Notice that
pressure and volume are not in phase. The pressure leads the volume by 90o (π/2 radians). This phaseshift
exists because of the 90o angle between the power and displacer pistons at the crankshaft
(see this figure).
Also, from this plot notice that the stirling engine runs at frequency of approximately 7.5 Hz. That is,
the engine completes 7.5 cycles per second.
|
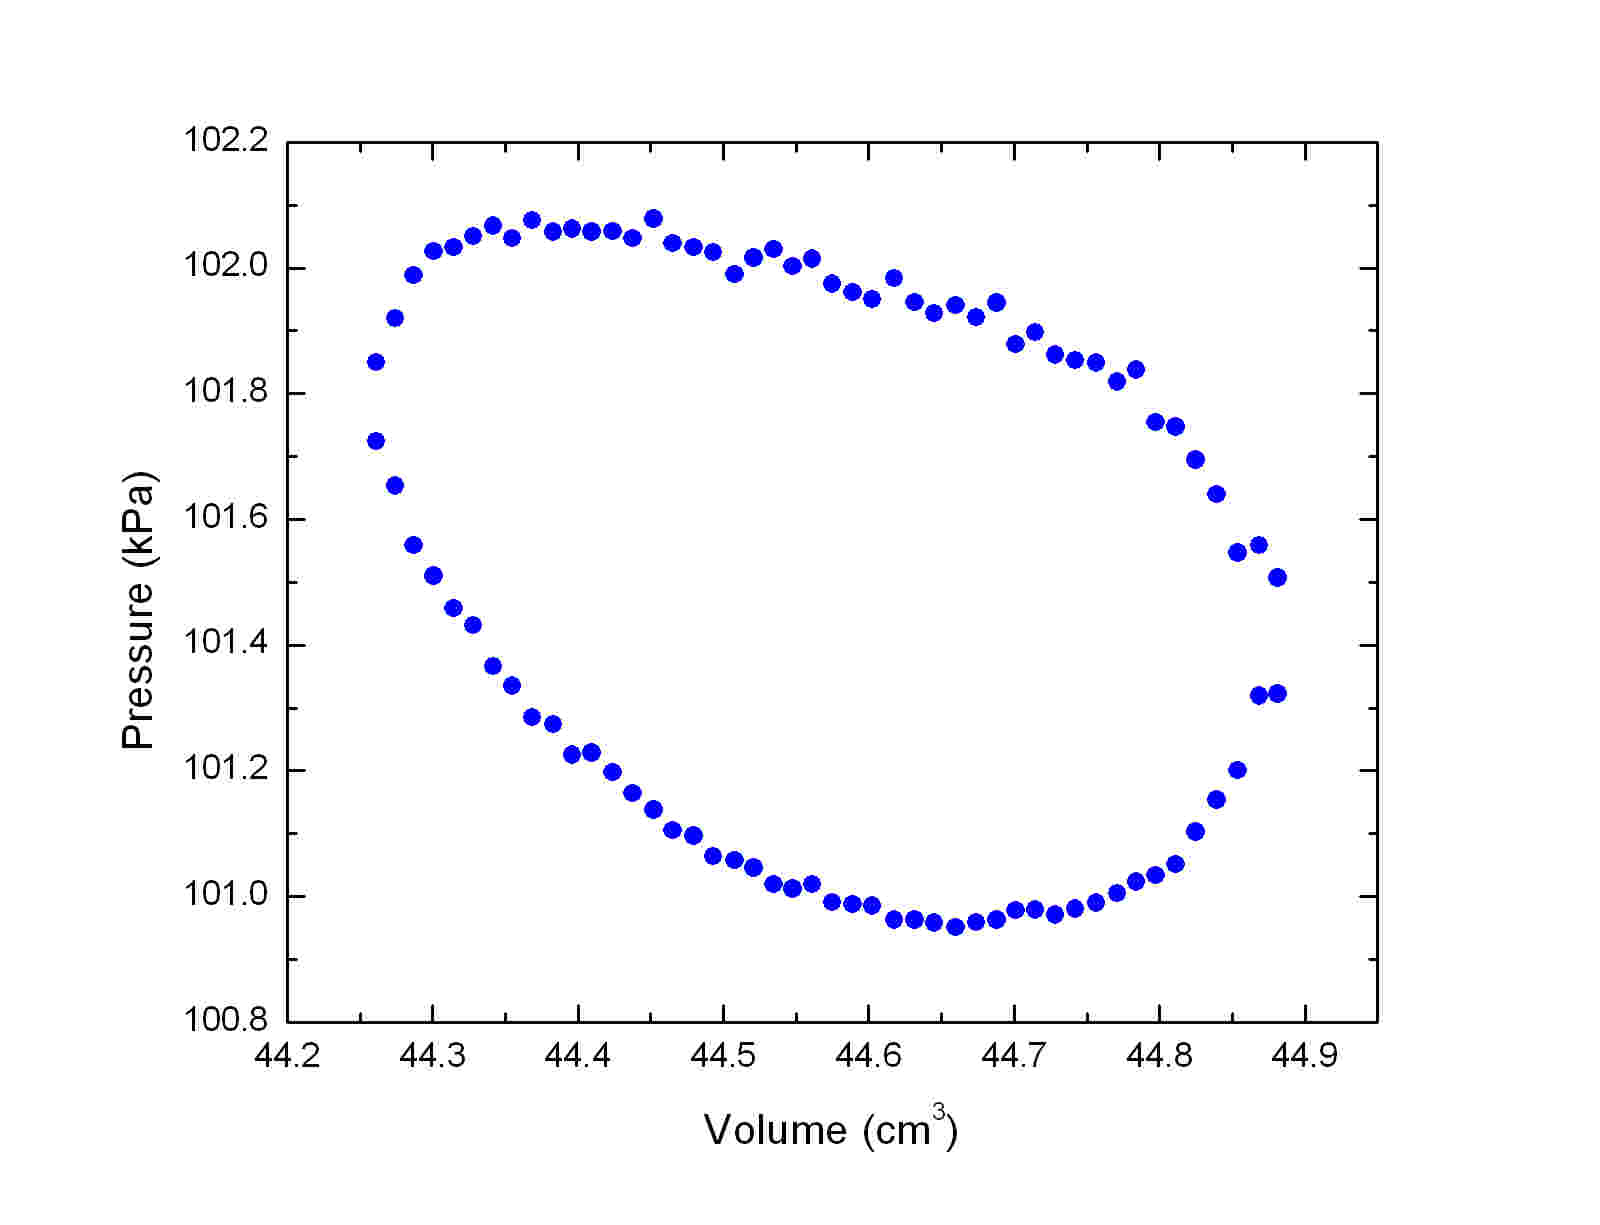
Figure 4: Measured PV-diagram
|
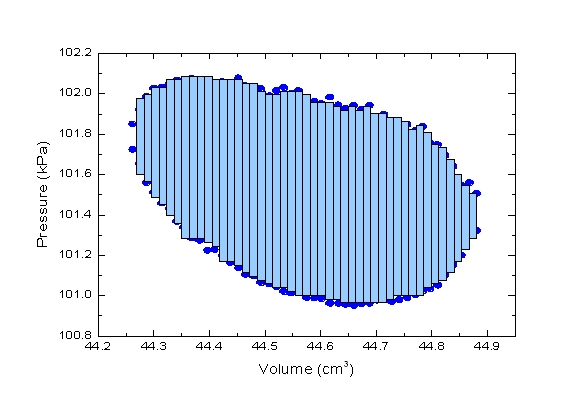
Figure 5: Area Calculation
|
|
The figure 4 shows the measured PV-diagram of this Stirling engine. This data was obtained
by averaging PV data over many cycles of the Stirling engine.
The work done per cycle is given by the area enclosed by the loop.
The area can be calculate approximately dividing the loop into many small rectangles
as shown in Figure 5. The total area is just the sum of areas of all the rectangles.
The work done per cycle by this stirling engine
is 0.46 mJ. The power of the stirling engine is given by the work divided by the time for each engine cycle.
Equivalently, the power is the product of work and the frequency. P = W × f = 3.4 mW, which corresponds to
4.6 micro-horse-power. The power of a typical car engine is 120 horse power, 26 million times more power than
this Stirling engine!
|
|