In this lab, we will use Microsoft Excel to produce spreadsheets.
A spreadsheet organizes information into a two-dimensional array of cells (a table). Each cell has a row number and column label which combine to represent its address. A cell location can store a number, text, or formula. The power of a spreadsheet is that we can write simple formulas (commands) to perform calculations and immediately see results of those calculations. Spreadsheets are very common in accounting and reporting applications.
TASK: Open Microsoft Excel (Start->All Programs->Microsoft Office 2013->Excel 2013) and explore its interface.
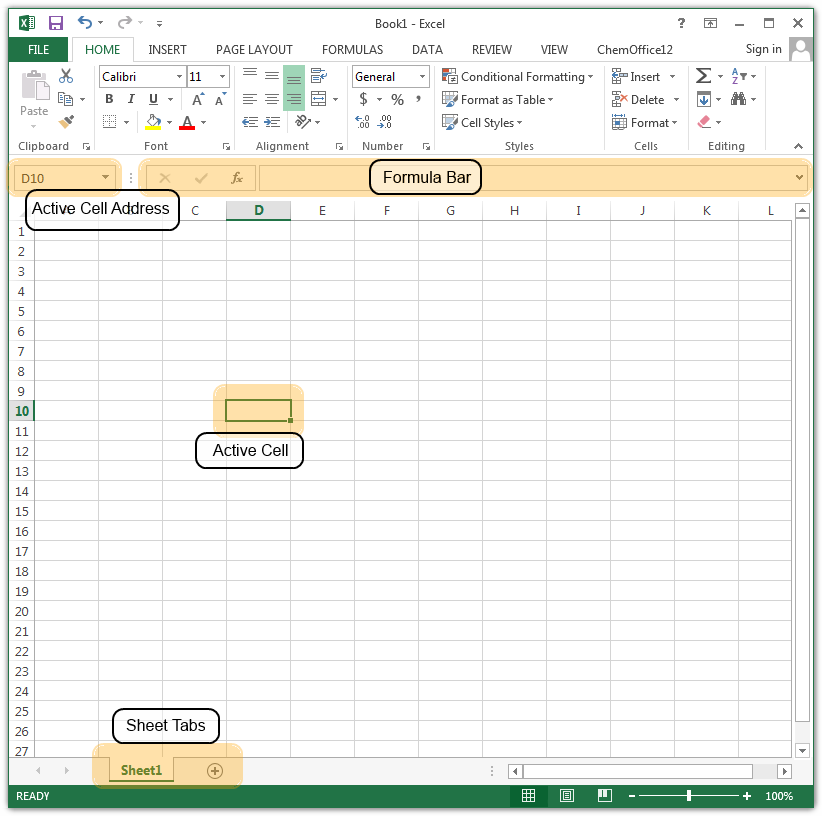
Data entry can be performed by typing data into a cell or formula bar. The data entered may be a text label, a value, or a formula. Formulas start with an equal sign ("=").
Cells can be selected in a variety of ways:
The common operations of cut, copy, and paste can be used with spreadsheet cells. However, there are some special features that simplify these activities:
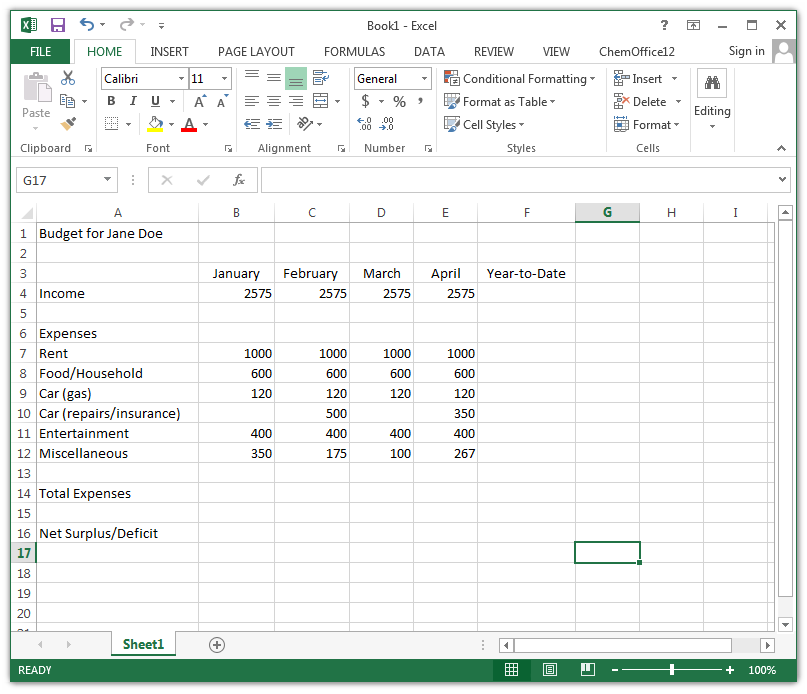
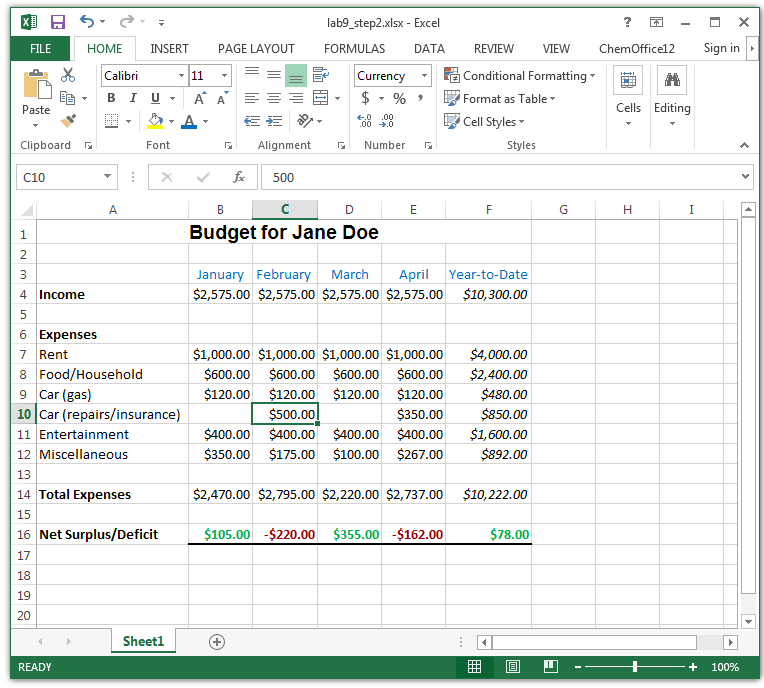
TASK: Enter data as shown below. Use copy techniques to avoid typing!
A formula is any expression that begins with an equal sign ("="). The equal sign indicates to the spreadsheet that a calculation must be performed to compute the value of the cell. An aggregate formula computes a summary function over a range of cells. The values can either be literals or cell locations. We will use the SUM() aggregate function for formulas in this lab.
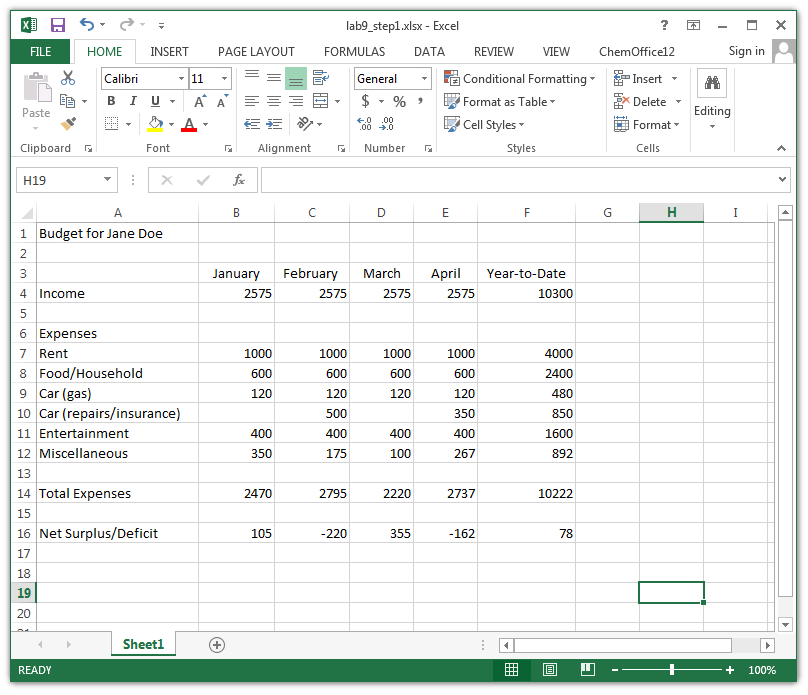
TASK: Create formulas that calculate values for the Year-to-Date, Total Expenses, and Net Surplus/Deficit cells as below.
Standard formatting consists of changing font types and sizes, colors, bold, italic, underline, etc., and can be performed like in a word processor using similar menu items and command buttons. It is also possible to format cells by selecting them and then selecting the Format menu option, then Cells...
TASK: Format cells as shown and described below.
Conditional formatting allows you to change the cell format based on data values.
TASK: Create conditional formatting on cells B16:F16 where cell font is red if negative and green if positive.
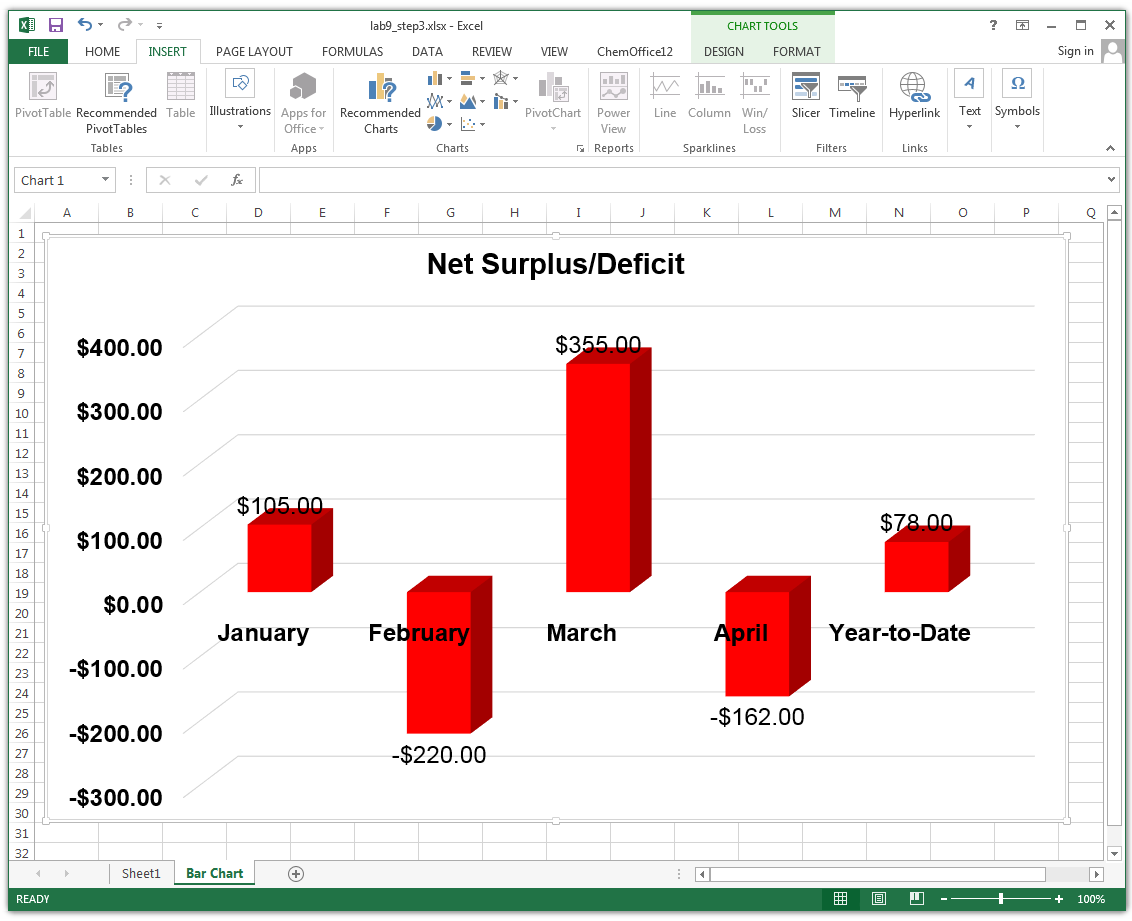
A chart is a graphical representation of spreadsheet data. A chart is of a particular type (line, bar, etc.) and requires the user to supply data that will be displayed in the chart.
TASK 1: Create a new 3D cluster-column chart with data cells B16:F16 and B3:F3. Details and diagram below.
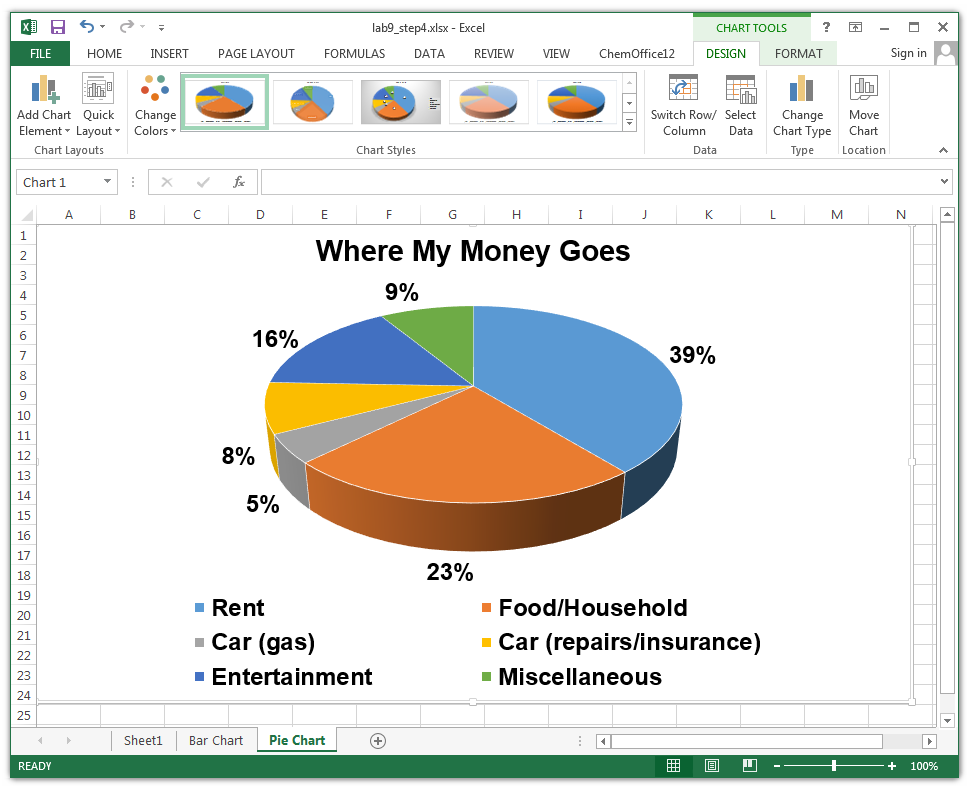
TASK 2: Create a new 3D pie chart with data cells A7:A12 and F7:F12. Details and diagram below.